Introduction
It seems that everybody has their own expected goals models for football nowadays but they all seem to be top secret and all appear to give different results so I thought I post a quick example of one technique here to try and stimulate a bit of chat about the best way to model them.
The Data
Over the past few weeks I have tediously collected several thousand xy co-ordinates for shot locations from Squawka and converted them into approximate distances from goal in metres, assuming that an average football pitch is 100m x 65m.
Goals Versus Distance
Figure 1 below shows the relationship between the probability of scoring a goal and how far away from the goal line the shot is taken from.
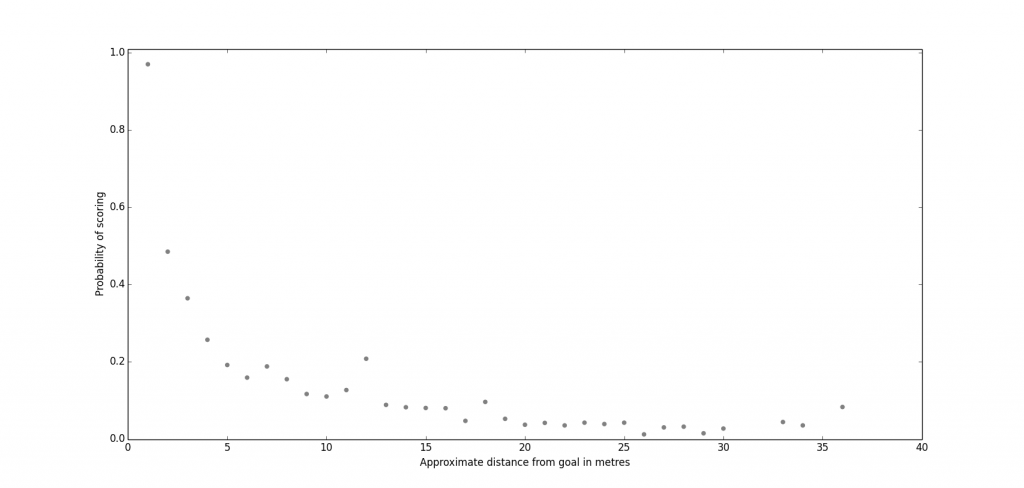
Figure 1: Shots Versus Distance From Goal
There seems to be a little bit of noise in the data, particularly around the 12-13m mark but overall I was pleasantly surprised how neat the data looks – there seems to be a pretty clear non-linear relationship between the likelihood of scoring and how far away from the goal the shot is taken from.
So how do we model this relationship? Obviously we cannot just stick a linear regression through the graph it as the relationship is clearly not linear so one possibility is to use a polynomial instead of a straight line (Figure 2).
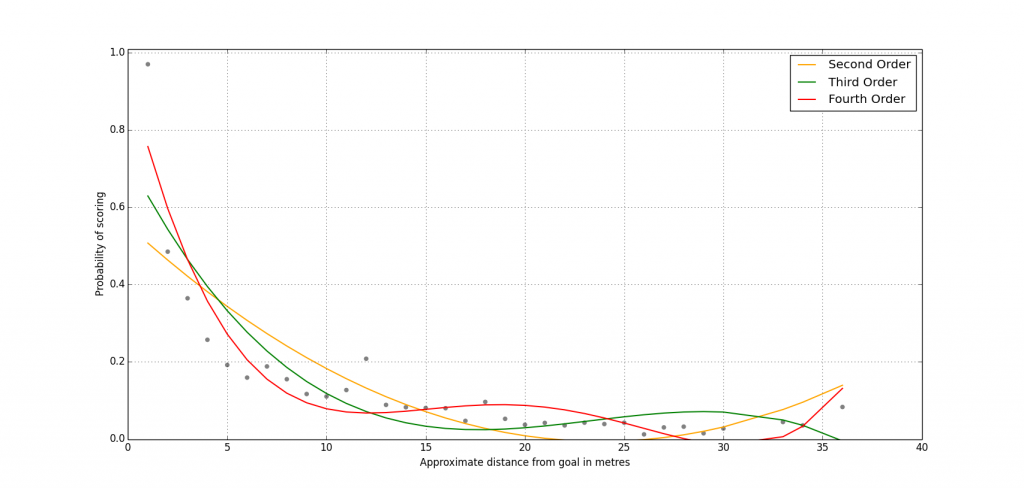
Figure 2: Fitting a Polynomial
Unfortunately, this does not give particularly good results as low order polynomials (the orange line) do not fit tightly enough to the non-linearity in the relationship while higher-order polynomials (the red line) start to fit to the noise in the data leading to problems with over-fitting.
So what do we do now? Well, looking closer the shape of the curve appears exponential so one option is to fit a Power function to it. We can do this pretty easily by taking the log of the data, fitting a linear regression against it and plotting this against our non-logged data (Figure 3).
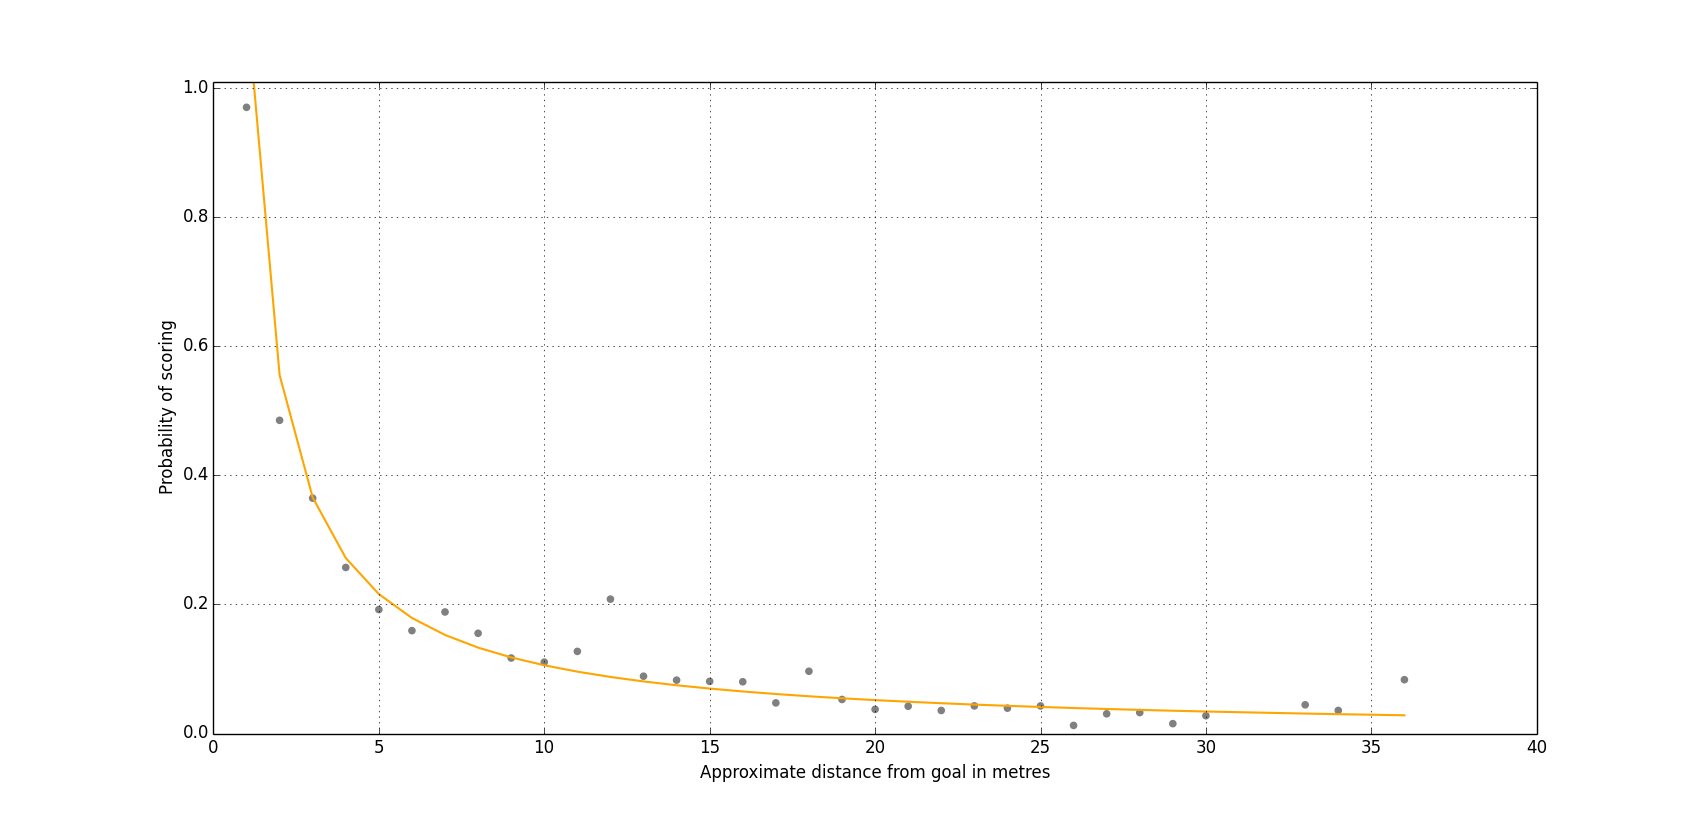
Figure 3: Power Curve
This gives an extremely good fit with the data and seems a plausible choice. We know goal scoring is Poisson distributed so it would seem natural to fit expected goals using an exponential shaped curve since Poisson and exponential distributions are inherently linked – the exponential distribution in fact describes the time taken between individual events occurring in a Poisson process.
If we calculate the r squared value for the fit of the Power curve then we get a value of 0.84, meaning 84% of the variance in goal scoring can be attributed to how far away the player taking the shot is from the goal. This is pretty impressive as it leaves just 16% attributed to other reasons, such as the angle of the shot, goalkeeper positioning, defensive pressure, the shooting player’s talent etc.
Before you ask, I’ll be looking at whether adding these additional factors into the model can improve it or whether the added complexity is not worth chasing the 16% for in the coming weeks.
Using the Expected Goals Model
But how do we use the model? Although everybody else’s models seem to be top secret I’m going to give mine away. The coefficient for the regression is $-1.036884$ and the intercept is $0.05950286$.
To put this into action all you need to do is raise the distance away from the goal in metres to the power of the coefficient and multiply by 10 to the power of the intercept. For example, a shot from 8 metres gives:
$8^{-1.036884} * 10^{0.05950286} = 0.132771$ expected goals
So how about we give it a proper test and try it out on this season’s English Premier League to date? The results are shown in Table 1 and overall give a root mean square error of 8.2 goals, which seems a pretty reasonable starting point for developing the model further from.
| Team | Goals | expG | Residual | |
|---|---|---|---|---|
| 1 | Man City | 68.00 | 46.90 | 21.10 |
| 2 | Liverpool | 63.00 | 42.56 | 20.44 |
| 3 | Arsenal | 48.00 | 35.26 | 12.74 |
| 4 | Chelsea | 48.00 | 42.56 | 5.44 |
| 5 | Man Utd | 41.00 | 35.26 | 5.74 |
| 6 | Southampton | 37.00 | 29.05 | 7.95 |
| 7 | Everton | 37.00 | 33.31 | 3.69 |
| 8 | Newcastle | 32.00 | 30.32 | 1.68 |
| 9 | Swansea | 32.00 | 26.89 | 5.11 |
| 10 | Tottenham | 32.00 | 31.21 | 0.79 |
| 11 | WBA | 30.00 | 31.17 | -1.17 |
| 12 | West Ham | 28.00 | 26.69 | 1.31 |
| 13 | Aston Villa | 27.00 | 24.20 | 2.80 |
| 14 | Stoke | 26.00 | 25.29 | 0.71 |
| 15 | Sunderland | 25.00 | 25.63 | -0.63 |
| 16 | Hull | 25.00 | 23.95 | 1.05 |
| 17 | Fulham | 24.00 | 24.39 | -0.39 |
| 18 | Cardiff | 19.00 | 24.67 | -5.67 |
| 19 | Norwich | 19.00 | 27.61 | -8.61 |
| 20 | Crystal Palace | 18.00 | 25.03 | -7.03 |
Table 1: Expected Goals For The English Premier League To Date
You can also see a pretty clear pattern in that the teams at the top of the league have generally over-performed the goal expectancy while those towards the bottom end have under-performed it. This would seem reasonable as we are predicting average goal expectancy and the top teams are obviously above average so should perhaps do better with their chances, while the lower teams are below average so would be expected to perform worse?
What Next?
I’m not claiming this to be the only way of calculating expected goals, or even the best way but hopefully it will encourage more discussion of how to calculate expected goals rather than a lot of secret black boxes all giving different results.
I hope to write more about expected goals over the coming weeks in order to test this equation to see how well it really works, to hopefully improve it further and to try and understand what the metric can and cannot tell us.
In the meantime, feel free to use my equation to calculate expected goals, all I ask is that you don’t try and pass the equation off as your own (you know who you are!!) and that if you use it then please acknowledge me and link back to my site.
Be warned though it’s a work in progress so is subject to change as and when I improve things…
Enjoy!